
Statistical analysis plays a key role in converting raw research data into meaningful findings. Generally, having a good understanding of the definition, types, tools, and steps to perform statistical analysis will help researchers to test hypotheses, identify patterns, interpret evidence, and draw reliable conclusions.
Research is not limited to gathering information and facts. As a researcher, you must have to comprehend the meaning of the data and how those data helps you achieve your goals through research. This is where statistical analysis plays a key role. No matter whether you are preparing a dissertation, writing a thesis, or carrying out a research project, statistical analysis will help you organize information, recognize patterns, and find out the relationship between different variables. Statistical analysis is categorized into different types, and hence selecting the appropriate technique for your research might be challenging if you are new to this process. If you would like to know everything about statistical analysis for quantitative research, read this blog. Here, we have discussed the statistical analysis definition, types, uses, tools, and workflow.
What is Statistical Analysis in Research?
Statistical analysis is a systematic process that involves gathering, organizing, analyzing, interpreting, and presenting numerical data for the purpose of answering research questions. It employs mathematical techniques to discover patterns, measure relationships, test hypotheses, and derive conclusions based on facts or evidence.
In academic research, the process of statistical analysis aids in moving past assumptions. So, rather than depending on personal opinions, researchers should use numerical evidence to support their arguments.
For example, consider a graduate student researching whether the study hours affect academic grades. The researcher collects data about students’ weekly study hours and examination scores. The statistical analysis helps them identify the existence of a relationship between these two variables.
Why is Statistical Analysis Important?
The statistical analysis serves several purposes in scientific research. The following are the key reasons why statistical analysis is important for research and how it helps researchers
- Organization of Data: It involves transforming large data sets into easily understandable tables, charts, and summaries.
- Pattern Identification: With statistical analysis, a researcher can find patterns, differences, and relationships in gathered data.
- Hypothesis Testing: Statistical analysis allows researchers to test whether the evidence or available data supports a proposed hypothesis or not.
- Decision Making: Statistical findings serve as a good basis for researchers to make valid decisions during research.
- Reliability Improvement: Appropriate statistical analysis techniques aid researchers in determining uncertainty and reducing errors of interpretation.
As per the American Statistical Association (ASA), a good statistical practice requires appropriate research design, proper analysis, and meaningful interpretation of results. Hence, statistical analysis should be considered an integral part of quantitative research and many mixed-methods studies.
A Statistics assignment expert at Great Assignment Help states, “Statistical analysis is not just about performing the computations. It is all about understanding what the numbers reveal, questioning the evidence, and connecting the findings to the research objectives.”
What are the Main Types of Statistical Analysis?

Before you select a technique for research, you should have a strong understanding of the different types of statistical analysis. Broadly, researchers use descriptive and inferential statistics. However, several other specialized methods are also available to answer particular research questions.
The following are some major types of statistical analysis techniques
Descriptive Statistical Analysis
Descriptive statistics are methods used to summarize and describe the important characteristics of a data set. They help the researchers understand the nature of their collected data without reaching any conclusions regarding the whole population.
Some common descriptive statistical techniques include the following
- Mean: It is the average value of a data set.
- Median: It is the middle value of a sorted observation list.
- Mode: It represents the value that occurs most frequently.
- Standard deviation: It is a measure of the deviation of numbers from the mean value.
- Frequency and percentage: It indicates how often certain answers or observations appear.
You can choose descriptive statistics if you want to summarize the gathered data. For example, a researcher who investigates student satisfaction might calculate the average satisfaction score among 150 respondents. This provides a quick overview of their responses.
Inferential Statistical Analysis
Inferential statistics utilize sample data to make estimates or draw conclusions about a larger population. Researchers use this approach only when it is not feasible to study the whole population.
Some commonly used inferential statistical analysis techniques include the following
- T-test: It compares the means of two groups.
- ANOVA: It examines the difference between the means of three or more groups.
- Chi-square test: It investigates the associations between two or more categorical variables.
- Correlation analysis: It measures the strength and direction of relationships between variables.
- Regression analysis: It examines how one or more predictor variables relate to an outcome.
You can use inferential statistics if you want to examine hypotheses or estimate the characteristics of a population. For instance, a researcher can compare examination scores of students attending online classes and traditional classroom sessions using an appropriate statistical test.
Predictive Statistical Analysis
Predictive analysis makes predictions about future events based on existing data using statistical models.
Regression analysis and time series analysis are some of the commonly used predictive statistical analysis techniques.
Predictive analysis is useful for forecasting. For example, a university can analyze its past enrolment records to predict the number of students likely to register for the next academic year.
Exploratory Data Analysis (EDA)
Exploratory Data Analysis involves examining datasets to understand their structure, identify unusual observations, and discover potential relationships.
EDA commonly uses histograms, scatterplots, boxplots, and summary statistics.
Exploratory analysis will help you understand your dataset before you apply more advanced techniques. NIST/SEMATECH e-Handbook of Statistical Methods discusses how graphical methods can be used to discover data patterns, detect anomalies, and help researchers assess statistical assumptions.
When and How Should Students Use Statistical Analysis?
Statistical analysis is especially helpful in research that includes numbers, questionnaires, experiments, or measurable relationships. But not all research questions need the same type of analysis.
When Should You Use Statistical Analysis?
Consider using statistical analysis when you need to
- Compare the academic performance of various student populations
- Measure the level of satisfaction of customers through survey responses
- Explore the relationship between income and education
- Assess the effectiveness of a teaching intervention program
- Identify trends in health care or economics datasets
- Test a hypothesis with numeric data.
For example, if your research examines the impact of social media on academic performance, statistical analysis can help you identify the relationship between daily screen time and examination results. However, correlation does not imply causation.
How Does Research Methodology Influence Statistical Analysis?
When conducting research, the way you gather and analyze your evidence depends on your methodology. Hence, choosing an appropriate methodology is one of the very first things you should consider when you start the research process. But before that, you should have a good comprehension of the differences between qualitative and quantitative research.
Quantitative research focuses on numerical measurements and statistical testing, while qualitative research studies experience, opinions, and meanings via interviews, observations, and textual information. Mixed-methods research combines both qualitative and quantitative research methods.
For instance, research about the effectiveness of online education could make use of survey responses to estimate the students’ satisfaction and interviews to explore the reasons behind those responses.
If you are exploring different research designs, this guide to types of research can help you understand the available approaches.
Overall, research methodology influences statistical analysis by determining how data is collected, measured, organized, and interpreted. It directly affects the accuracy, reliability, and validity of statistical results.
What are the Common Tools Used for Statistical Analysis?
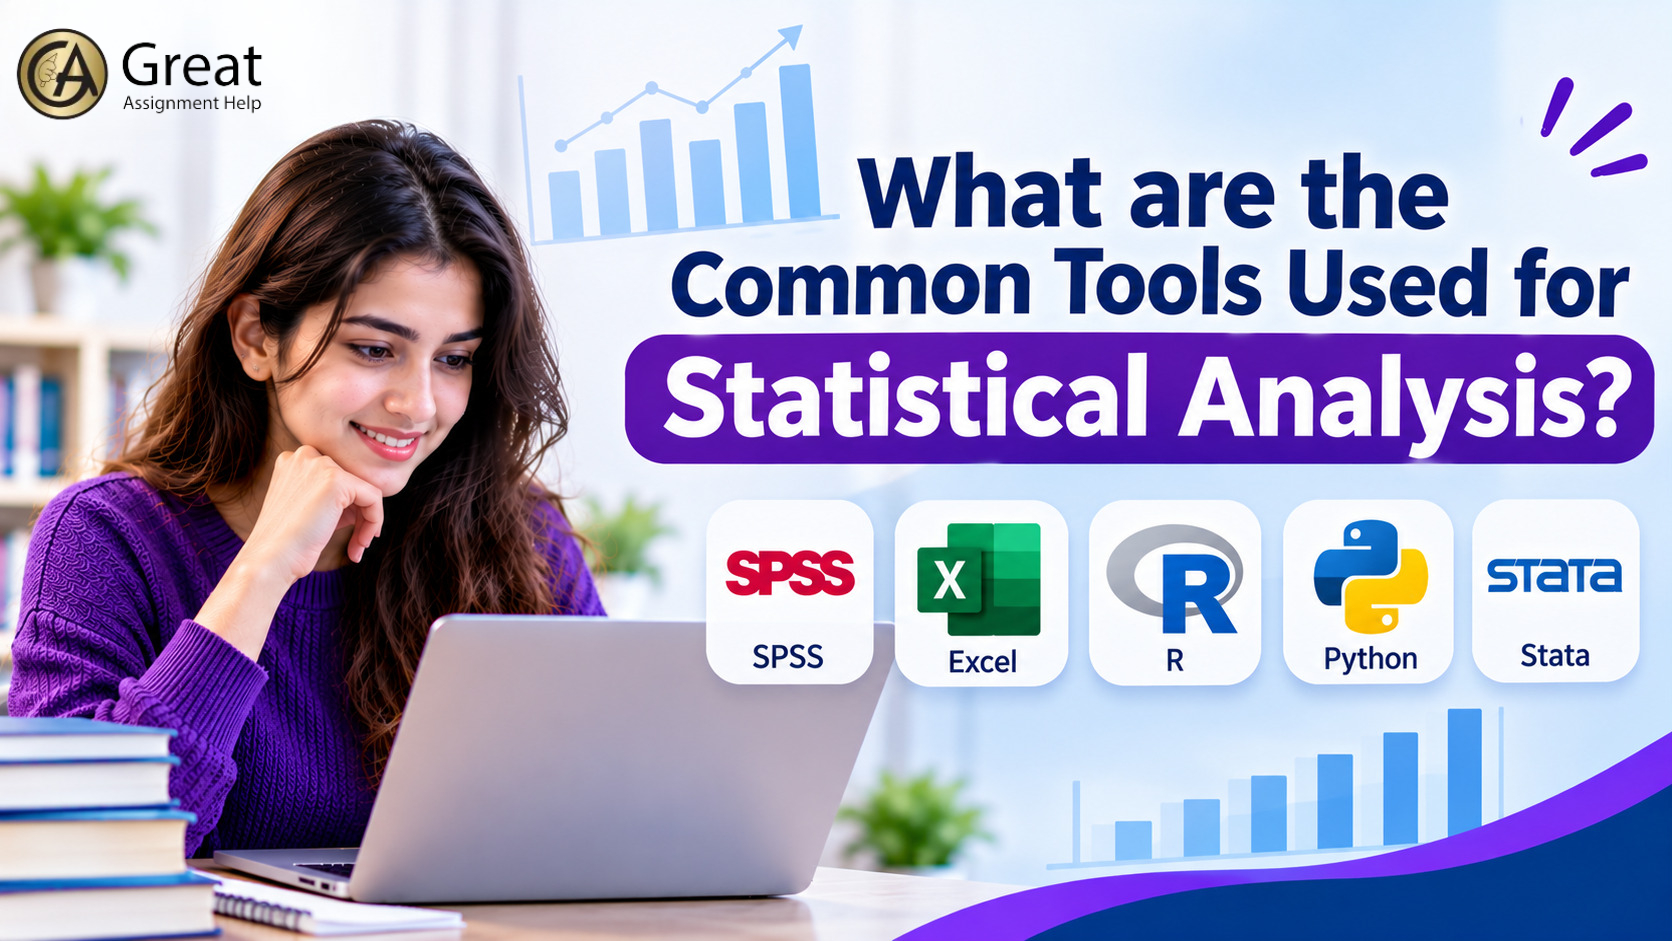
Several software applications are available to analyze research data. When it comes to performing statistical analysis, students should make sure to pick the right tool based on the complexity level of their study, research area, and their technical skills.
These are some common tools that help to conduct statistical analysis
SPSS
SPSS stands for Statistical Package for the Social Sciences. It is extensively used in fields such as education, psychology, healthcare, and social sciences. SPSS provides features for descriptive statistics, hypothesis testing, regression, correlations, and visualization of data. Moreover, it has a user-friendly, menu-based interface that is easily accessible even for beginners.
Microsoft Excel
Excel is a good tool for students who are dealing with smaller sets of data. It supports basic calculations, frequency distributions, averages, percentages, charts, and simple statistical functions. However, more specialized software might be required to conduct advanced research.
R Programming
This is an open-source programming language that is used for statistical computations and data visualization. It enables advanced modeling, hypothesis testing, regression, and reproducible analysis. R programming is especially helpful for graduate students working with complex datasets.
Python
Python supports statistical analysis through various packages and libraries, including Pandas, NumPy, SciPy, and Statsmodels. It is useful for data cleaning, statistical modelling, automation, and large-scale data analysis.
Stata
Stata is commonly used in economics, public health, political science, and social research. It offers tools for regression analysis, panel data analysis, hypothesis testing, and econometric modeling.
Key Steps to Perform Statistical Analysis
Do you wonder how to perform statistical analysis? If yes, then by following this structured framework, you can organize your research activities
1. Define your research question
Identify the topic you intend to research first.
The research question may be something like “Does the number of hours spent studying influence university students’ examination performance?”
Forming a clear research question will make it easy for you to identify what type of information you require.
2. Select the research design
Choose an appropriate research methodology depending on your study objectives. For instance, you can use an experimental, descriptive, correlational, or survey-based design.
In addition, you should explain your choices in the methodology section. For additional guidance, read this article on how to write a methodology.
3. Collect relevant data
Gather relevant information using the right method, such as questionnaires, experiments, observation, or available datasets.
If you are collecting primary data, make sure that the questions are clear and relevant. In case you are unsure how to prepare an effective questionnaire, read this article on how to design a research survey.
4. Clean and organize the dataset
Before you start analyzing, check your dataset for missing observations, duplicate entries, incorrect values, inconsistent formats, and unusual observations.
After cleaning, describe how you manage missing observations and outliers. While organizing, do not omit observations from your dataset simply because they fail to confirm your hypothesis.
5. Choose the appropriate statistical technique
Select an appropriate method in accordance with your research question, types of variables, experimental design, and statistical assumptions.
For example, you can use
- T-test for comparing two group means
- ANOVA for comparing three or more group means
- Correlation for studying relationships between numeric variables
- Regression analysis for estimating relationships between predictors and outcomes
- Chi-square tests for studying relationships between categorical variables.
6. Conduct the analysis
Enter the cleaned data into the software you have chosen and complete the necessary computations. After you finish the analysis, create appropriate tables, graphs, descriptive statistics, and statistical tests.
7. Interpret and report your findings
Interpret the results and explain their implications for your research goals. After result interpretation, report appropriate statistics, like test statistics, p-values, confidence intervals, and effect sizes, when necessary.
8. Draw Conclusions
Finally, after understanding the findings and identifying patterns or relationships, summarize the findings and make decisions based on the analysis.
Statistical Analysis in Research: A Practical Example
Consider a graduate-level research project on the title “The relationship between study hours and academic performance among university students”.
As a researcher, for this study, you should gather data from 100 university students. In the collected dataset, you should identify the variables. The two variables in this study are the number of study hours per week and the examination scores.
Once you have collected the data and identified the variables, you should begin your analysis with these approaches
Research activity: Statistical approach
Summarize the examination scores: Mean and standard deviation
Analyze study hour distribution: Frequency distribution
Visualize the relationship: Scatterplot
Measure the association: Pearson or Spearman correlation, as appropriate
Estimate the relationship: Linear regression, if assumptions are suitable
If, in this analysis, you get a correlation coefficient equal to 0.65 with a p-value less than 0.05, then the result suggests that there is a positive relationship between study hours and examination scores, and there is enough evidence to reject the null hypothesis of no linear relationship according to the underlying model.
However, it does not confirm that there exists a cause-and-effect relationship between studying and performance. There might be other factors affecting one’s academic success, including knowledge base, teaching effectiveness, and learning habits.
This example shows why statistical results should always be interpreted considering the research design.
Conclusion
Statistical Analysis plays a key role in the transformation of raw numerical information into valuable research results. Since every statistical approach, from descriptive statistics to regression models, serves different purposes, you need to choose the right technique for the study based on your research question, methodology, reliable data, and knowledge of statistical assumptions. Especially when performing statistical analysis, it is also essential for you to present your research findings clearly while recognizing the limitations of the study. As a result, you can derive evidence-based conclusions for your study.
Begin learning the basics, practice using real datasets, and gradually explore more advanced statistical techniques as your research requirements grow. If it is tough for you to identify the right method or conduct statistical analysis, approach Great Assignment Help. The subject professionals from our team will offer you customized statistics assignment help that will enable you to achieve the exact outcomes and enhance your academic performance.
Frequently Asked Questions (FAQs)
1. What is the main purpose of statistical analysis in research?
The main purpose of statistical analysis is to organize, analyze, and interpret numbers. It also helps researchers to identify patterns, test hypotheses, measure relationships, and draw evidence-based conclusions.
2. What are the two main types of statistical analysis?
Descriptive and inferential statistics are the two main types of statistical analysis. Descriptive statistics involve summarization of gathered data, while inferential statistics make estimates or draw conclusions from sample data about a large population.
3. Which statistical analysis tool is best for beginners?
Microsoft Excel and SPSS are the best statistical analysis tools for beginners in the field. Excel helps users to calculate and visualize data, whereas SPSS provides options for conducting different types of statistical tests using user-friendly tools and it does not require extensive programming knowledge.
4. How do I choose the right statistical test for my research?
You can select the right statistical test for your research based on your study objectives, variable types, study design, sample structure, and statistical assumptions. For example, with a t-test, you can compare two groups, and correlation analysis will help you examine the association between variables.
5. Can qualitative research use statistical analysis?
Qualitative research is conventionally done using non-statistical data and methods such as thematic analysis. However, qualitative research can use numeric summaries, and mixed-methods research can combine statistical analysis with qualitative data.