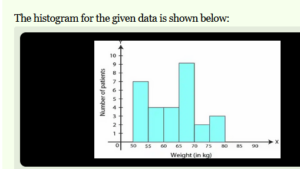
The weight of 29 patients in a hospital were recorded as follows: Posted: 18-07-2022 Weight (in kg) 50−55 55−60 60−65 65−70 70−75 75−80 Number of patients 7 4 4 9 2 3 Draw a histogram to represent this data visually. Answer:-