Ecg Signal Analysis and Filter
Question :
The data has been digitized (with a sampling rate of 1kHz) at source and stored for future analysis. This data is in its ‘raw’ unprocessed form and it is suspected that the signal is contaminated with three different noise components; low frequency noise due to motion artifacts, high frequency noise introduced by the electronic measurement system and power line interference at 60Hz (the data was acquired in the US). You are told that during acquisition an electronic notch filter had been implemented to remove power line interference - but it was a piece of old equipment that is thought not to function properly.
It is your task to investigate to what extent these noise sources are present in the signal and design suitable filters for their removal.
Please write your analysis up in the form of a report containing all MATLAB scripts, figures, discussion and analysis. Also, be sure to present time and frequency domain plots of all your filtered signals from which the success of your efforts will be gauged. You should discuss and justify the filter parameter values used and critically analyse your results. Please limit the number of low and high pass filters presented to one IIR and one FIR for each type of noise source (i.e. 2 filters per noise source)
Answer :
ECG Signal Analysis and Filter
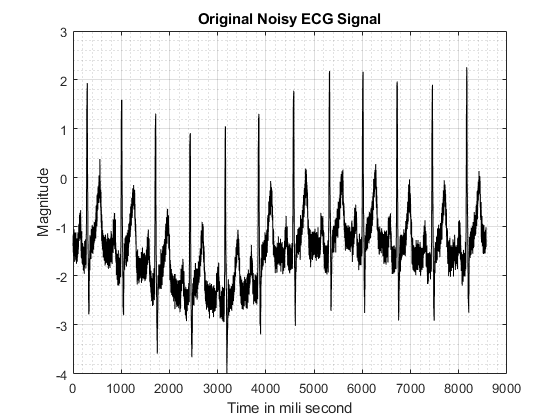
Time Domain Analysis of the Signal
ECG signal is obtained with a sample frequency of 1 kHZ. the signal contains a noize of high frequency, frequency 60 HZ and contains some low frequency noise. The acquired signal is present in the following text file.
Raw_Data=load('1587589330_409005612.txt');
L = length(Raw_Data); % Length of the signal
% figure(1)
% plotting the time domain figure
plot(Raw_Data,'k') % Plotting the time domain data
title('Original Noisy ECG Signal')
xlabel('Time in mili second')
ylabel('Magnitude');
% xlim([543 8725])
% ylim([-3.94 2.43])
grid on
grid minor
Frequency Domain Analysis
%% Frequency domain Analysis
Fs=1000; % Sampling Frequency
Y = fft(Raw_Data); % doing the spectral analysis using Fast forier transform
P2 = abs(Y/L); % Taking half the signal
P1 = P2(1:L/2+1); % Length of the signal plotted to half for analysis purpose
P1(2:end-1) = 2*P1(2:end-1);
f = Fs*(0:(L/2))/L; % Obtaining the corresponding frequencies
plot(f,P1,'k') % plotting frequency domain the spectral plot
title('Single-Sided Amplitude Spectrum of ECG Data')
xlabel('Frequency in term of HZ')
ylabel('Magnitude')
grid on
grid minor
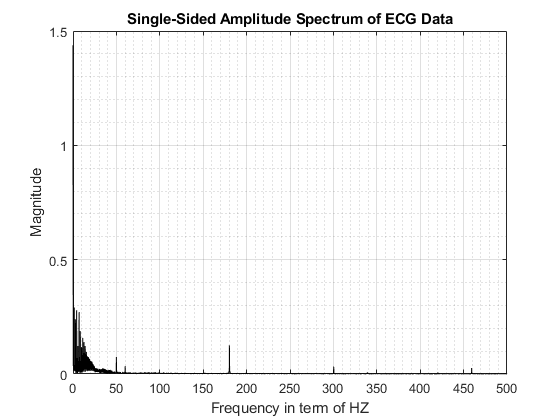
Explanation on the Frequency domain Analysis
As we can see in the frequency domain analysis there are 3 different types of frequency component present in the signal. These noise can be catagorised in to 3 different component which are mentioned in the below section in detail.
1. Noise which are of High frequency component:- these noise can be removed by the application of Low pass filter. After application of a low pass filter these High frequency component will be filtered out. (FIR filter is used for this purpose)
2. For removing Low frequency noise we have to apply High pass filter which will remove the corresponding noise.(IIR filter is used for this purpose)
3. As mentioned in the document 60HZ Power line interfearance is present in the signal which need to be removed. for this purpose we need to apply a notch filter which will filterout the perticular noise frequency at 60HZ. we can see in the frequency spectrum there is a magnitude of frequency in the range of 60 HZ frequency.(IIR filter is used for this purpose)
Applying these filer sequentially we will process the input ECG signal and we will compare the result at the end of this report.
1-a) Designing the FIR Filter for the Low Pass filter design and applying the signal through the filter
%designong a low pass filter
lpFilt_fir=designfilt('lowpassfir','FilterOrder',100,'CutoffFrequency',61,'SampleRate',Fs);
fvtool(lpFilt_fir)
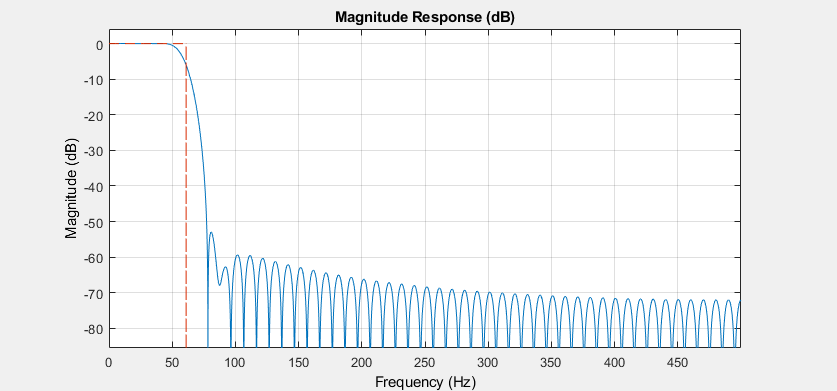
This is the structure of the FIR filter that is being developed to filter the signal. A higher order filter is chooses to have less error while doing the filtering. The above filter will be applied to the ECG signal to filter out the low frequency component. The filter will remove the high frequency noise that is present in the signal. As we Need to remove the noise after 60 HZ as 60HZ frequency is introduced due to power line. so here we have considered the 60HZ frequency. this is the reason we have considered 61 HZ as the cutoff frequency for the low pass filter.
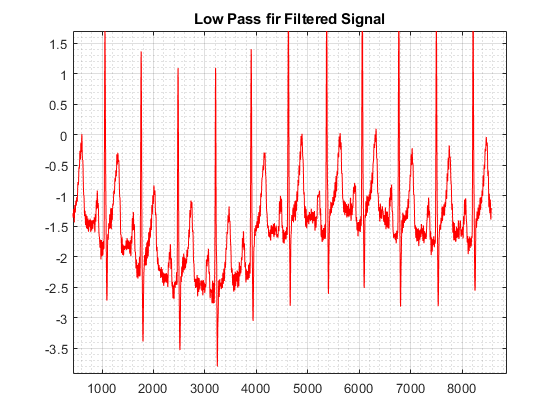
1-a) Filtering The ECG signal with the help of the FIR Low pass filter to remove high frequency noise present in the ECG signal.
Filt2_Data_fir=filter(lpFilt_fir,Raw_Data);
plot(Filt2_Data_fir,'r');
grid on
grid minor
title('Low Pass fir Filtered Signal')
xlim([436 8874])
ylim([-3.92 1.70])
% Setting propoer limit to view the signal
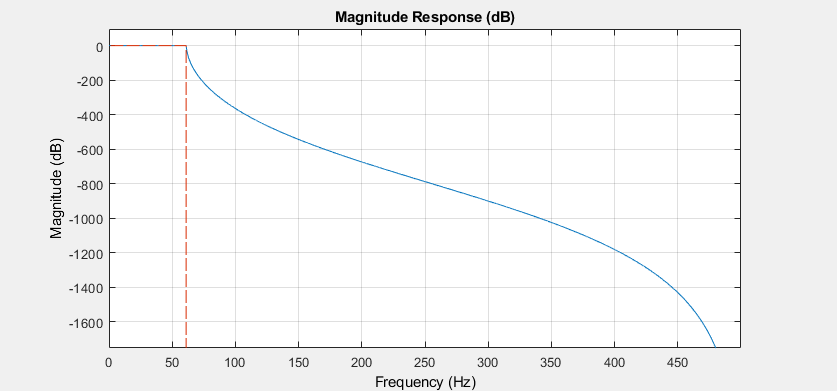
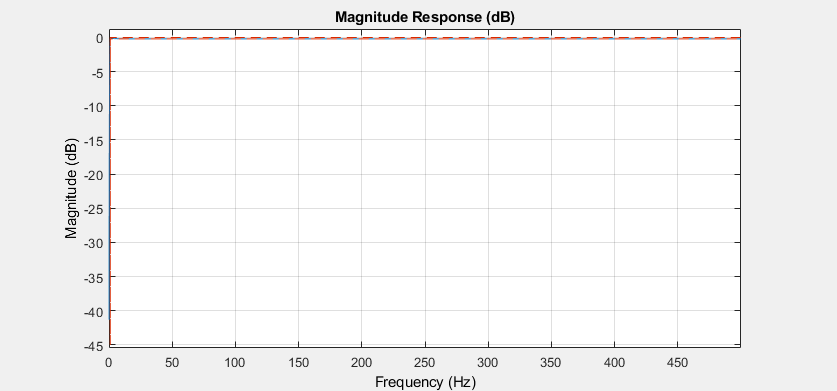
1-b) IIR filter design for the cutoff frequency 61 Hz as like FIR filter
lpFilt_iir = designfilt('lowpassiir','FilterOrder',40,'PassbandFrequency',61,'PassbandRipple',0.2,'SampleRate',Fs);
fvtool(lpFilt_iir)
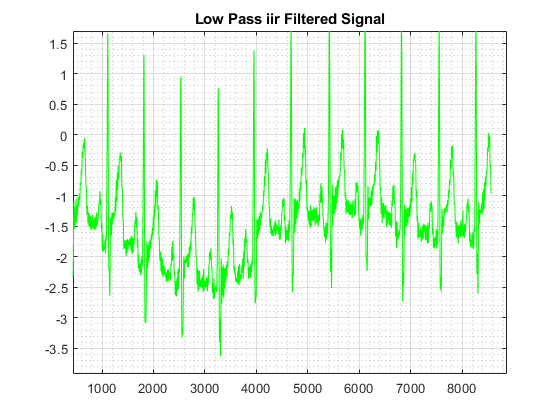
Filt2_Data_iir=filter(lpFilt_iir,Raw_Data);
plot(Filt2_Data_iir,'g');
grid on
grid minor
title('Low Pass iir Filtered Signal')
xlim([436 8874])
ylim([-3.92 1.70])
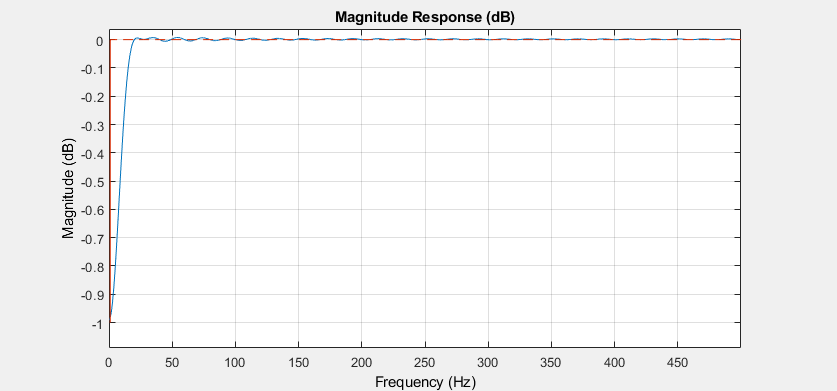
2-a) Designing High Pass Filter to Filter Out High Frequency Component
After the signal is passed through the Low Pass filter we need to remove Low frequency noise. As we can see in the spectral analysis the low frequency noise present in the signal is present below 1 HZ. this is because the instrument used for the measure ment porpose. The main objective of this filter is to filterout the low frequency noise present in the signal. As per the assignment we need to have a IIR filter for this purpose. so the following script uses the IIR filter. this filter will do the required filtering of the signal.
%% High pass filter fir
hpFilt_fir=designfilt('highpassfir','FilterOrder',100,'CutoffFrequency',1,'SampleRate',Fs);
fvtool(hpFilt_fir)
grid on
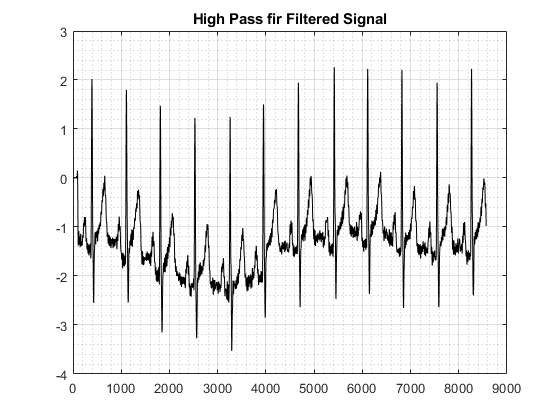
Applying the Data through The High Pass Filter
Filt22_Data_fir=filter(hpFilt_fir,Filt2_Data_fir);
plot(Filt22_Data_fir,'k');
% xlim([0 4000])
title('High Pass fir Filtered Signal')
grid on
grid minor
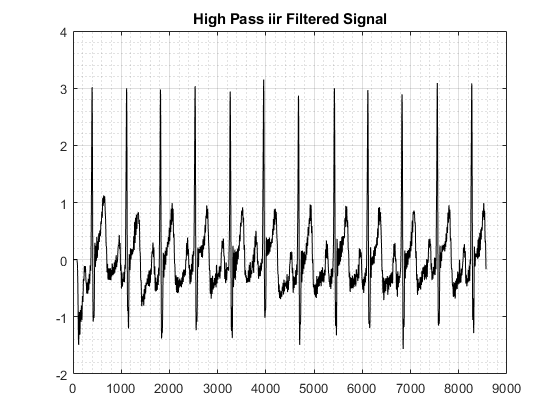
2-b) Application of IIR Low pass fileter to remove low frequency noise
%% High pass filter
hpFilt_iir = designfilt('highpassiir','FilterOrder',2, ...
'PassbandFrequency',1,'PassbandRipple',0.2, ...
'SampleRate',Fs);
fvtool(hpFilt_iir)
Filt22_Data_iir=filter(hpFilt_iir,Filt2_Data_iir);
plot(Filt22_Data_iir,'k');
% xlim([0 4000])
title('High Pass iir Filtered Signal')
grid on
grid minor
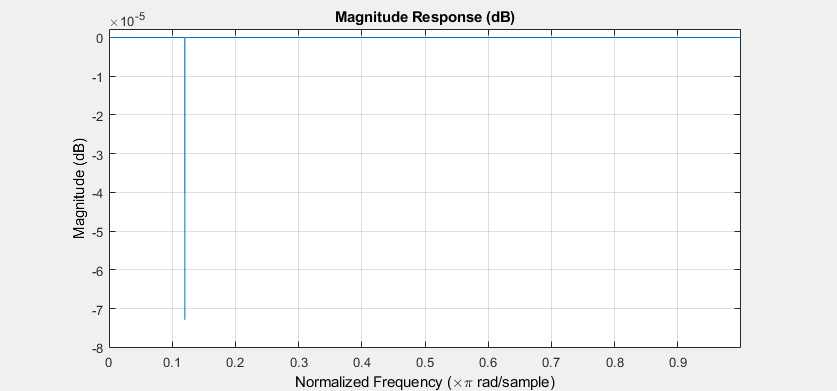
3-Applying Notch filter to remove the noise at frequency of 60 HZ
wo = 60/(Fs/2); % converting the frequency in to angular frequency
bw = wo/3000000; % Determining the quality factor fot the notch filter
[b,a] = iirnotch(wo,bw); % taking the filter coeffecient for the filter design
fvtool(b,a) % plotting the filter
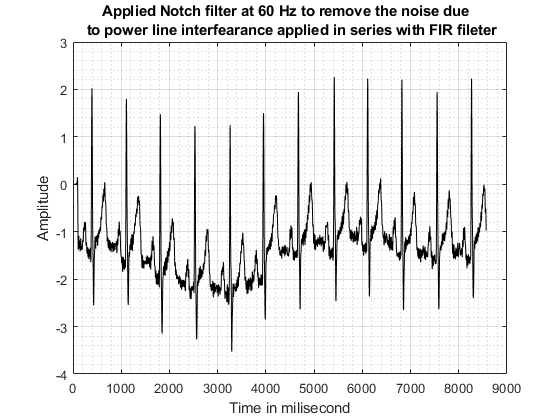
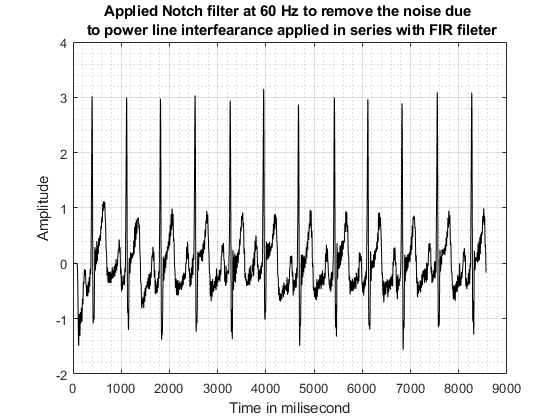
3-a) Final plotting for IIR filtered signal with Notch filter with FIR Filter
Filt222_Data_fir=filter(a,b,Filt22_Data_fir); % using the filter filtering out the data
plot(Filt222_Data_fir,'k') % plotting the filtered data
title(sprintf('Applied Notch filter at 60 Hz to remove the noise due \n to power line interfearance applied in series with FIR fileter'))
grid on
grid minor
xlabel('Time in milisecond');
ylabel('Amplitude');
3-b) Final plotting for IIR filtered signal with Notch filter with FIR Filter
Filt222_Data_iir=filter(a,b,Filt22_Data_iir); % using the filter filtering out the data
plot(Filt222_Data_iir,'k') % plotting the filtered data
title(sprintf('Applied Notch filter at 60 Hz to remove the noise due \n to power line interfearance applied in series with FIR fileter'))
grid on
grid minor
xlabel('Time in milisecond');
ylabel('Amplitude');
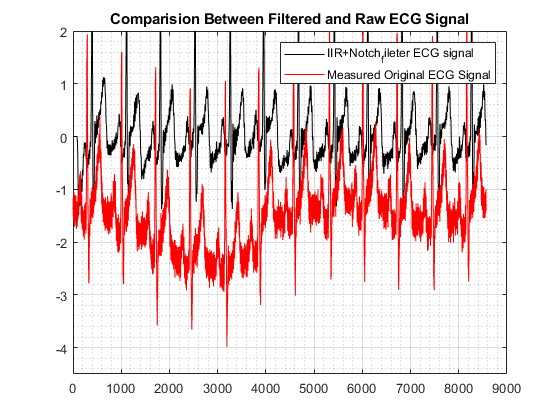
Plotting the Filtered data over the Raw data
plot(Filt222_Data_iir,'k')
hold on
plot(Raw_Data,'r')
grid on
grid minor
legend('IIR+Notch_fileter ECG signal','Measured Original ECG Signal');
title('Comparision Between Filtered and Raw ECG Signal');
xlim([0 9000])
ylim([-4.5 2.00])
hold off
plot(Filt222_Data_fir,'k')
hold on
plot(Raw_Data,'r')
grid on
grid minor
legend('FIR+Notch_fileter ECG signal','Measured Original ECG Signal');
title('Comparision Between Filtered and Raw ECG Signal');
xlim([0 9000])
ylim([-4.5 2.00])
hold off
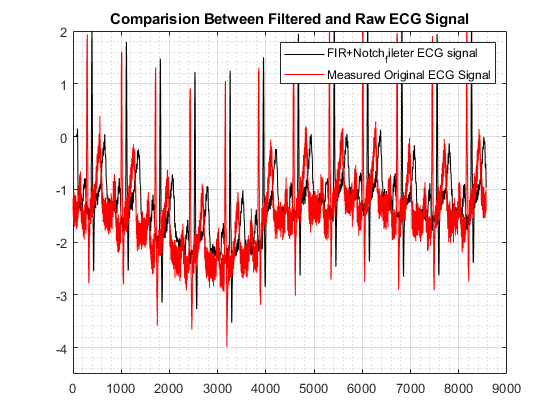
Result Analysis
As we can see from the analysis point of view the black coloured signal is having less noise compared to the red signal which is the raw data taken as an input. A heavy amount of noise is being removed from the raw data. This is possible by the application of High pass, Low pass filter and notch filter.
in the above analysis there are 3 different stages through which a signal is apssed through which are the following
1- in stage 1 we apply IIR and FIR filter to raw signal and generate filtered signal 1
a> represents application of FIR filter
b> represents application of IIR filter
2- in stage 2 we apply IIR and FIR filter to the filtered signal 1 and generate filtered signal 2.
a> represents application of FIR filter
b> represents application of IIR filter
3- in stage 3 we apply Notch filter to signal to both IIR and FIR filtered signal that we have obtained which is signal 2 and generated the final filtered signal which is signal 4.
a> represents application of FIR filter + Notch Filter
b> represents application of IIR filter+ Notch Filter