Market Entry Strategy Report for Nokia Networks
Question :
It is year 2005.You have been appointed as a Head of International Marketing Startegy for Nokia Networks. You have been asked to prepare a Market Entry Strategy (in the form of a report) for the GCC region. The main purpose of this assignment is, after conducting a thorough market analysis, to recommend which market (either Saudi Arabia, Kuwait, Qatar or United Arab Emirates) should Nokia Networks enter first. Your market entry recommendation must be supported and justified by credible reasoning and suitable evidence.
You have been given data sheets for these four GCC mobile communication markets (i.e. Saudi Arabia, Kuwait, Qatar and United Arab Emirates). As a suggestion, you should choose minimum of six important market variables from these data sheets and compare them across the four markets to get a good feel for the market trends that will indicate the mobile communication market potential in the future. Examples of suitable market variables could be Population, Nominal GDP per capita, Total Mobile Reveneues etc. Furthermore, as a requirement, you should analyze the selected six variables over a four year period (i.e. 2007, 2008, 2009 and 2010) to understand important trends within the GCC mobile telecommunications market.
Answer :
Introduction
The focus of this report is to assess available market data and build a market entry strategy for Nokia Networks. In this report, six variables have been analyzed. The markets picked for analysis are Saudi Arabia, Kuwait, Qatar, and United Arab Emirates (UAE). The data of four years, from 2007 to 2010 has been picked. A comparison of these markets have been conducted based on the data of those six variables. Based on the analysis, one market out of four has been recommended for Nokia Networks to enter. The report is divided into several sections showing all six variable analysis, and ending with a chapter on recommendation and conclusion.
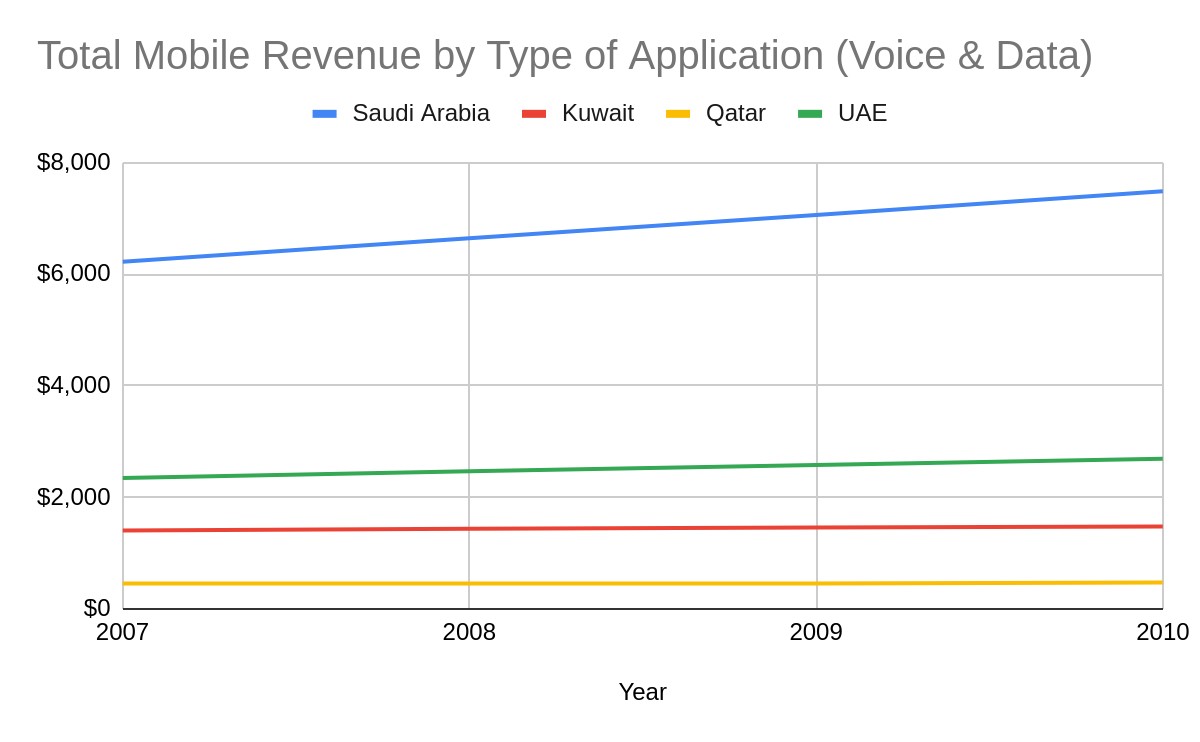
Total Mobile Revenues
In the graph below, the total mobile revenue generated in all four markets are shown. It can be seen that Saudi Arabia has generated way more revenue than other three markets. Moreover, the line graph of Saudi Arabia shows higher growth in revenue year on year in comparison to other market’s graph. This shows that the Saudi Arabian market has significant potential in terms of bringing in sales for the company.
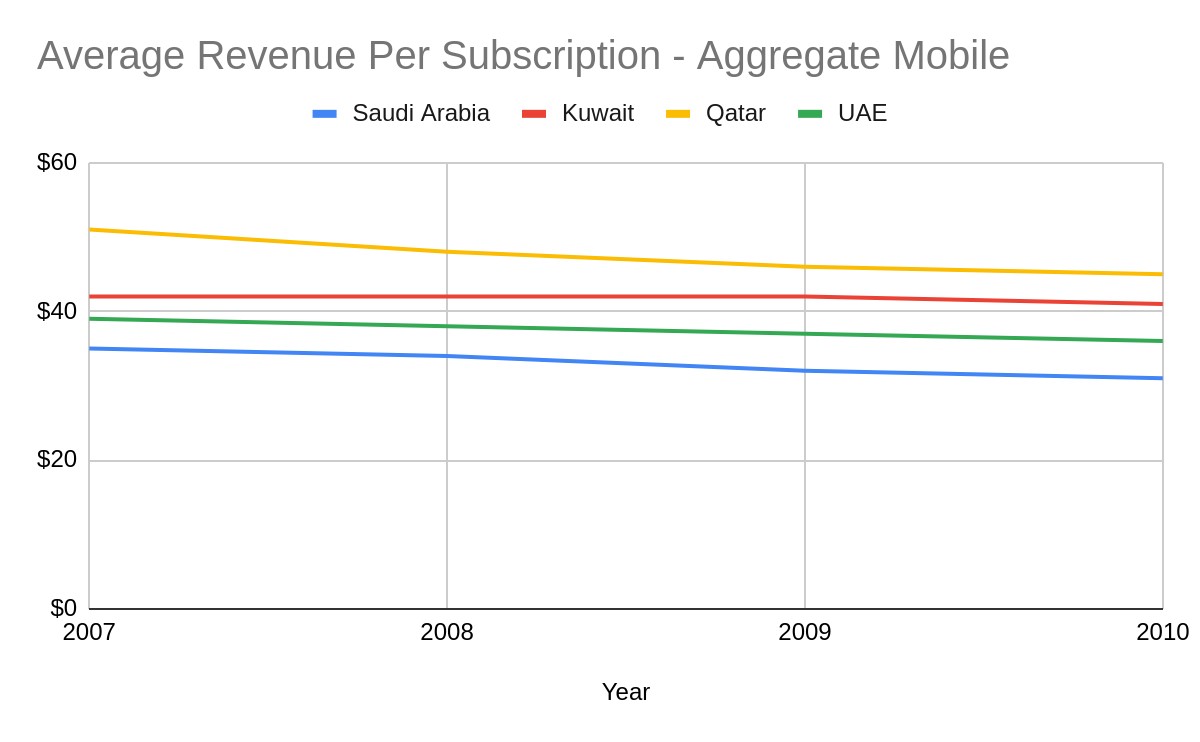
Average Revenue Per Customer
In the second graph below, average revenue per customer has been shown. Here, it can be seen that the graph has completely gone upside down in comparison to the previous graph. Here, it can be seen that Saudi Arabia is at the bottom when it comes to revenue per subscriber, whereas Qatar tops the list. It means that in terms of individual customers, Qatar is more profitable than Saudi Arabia and other markets. So even with less penetration, revenue can be generated. On the other hand, in Saudi Arabia, the company has to have higher penetration. Regarding trends, per subscriber revenue seems to be falling down over the years.
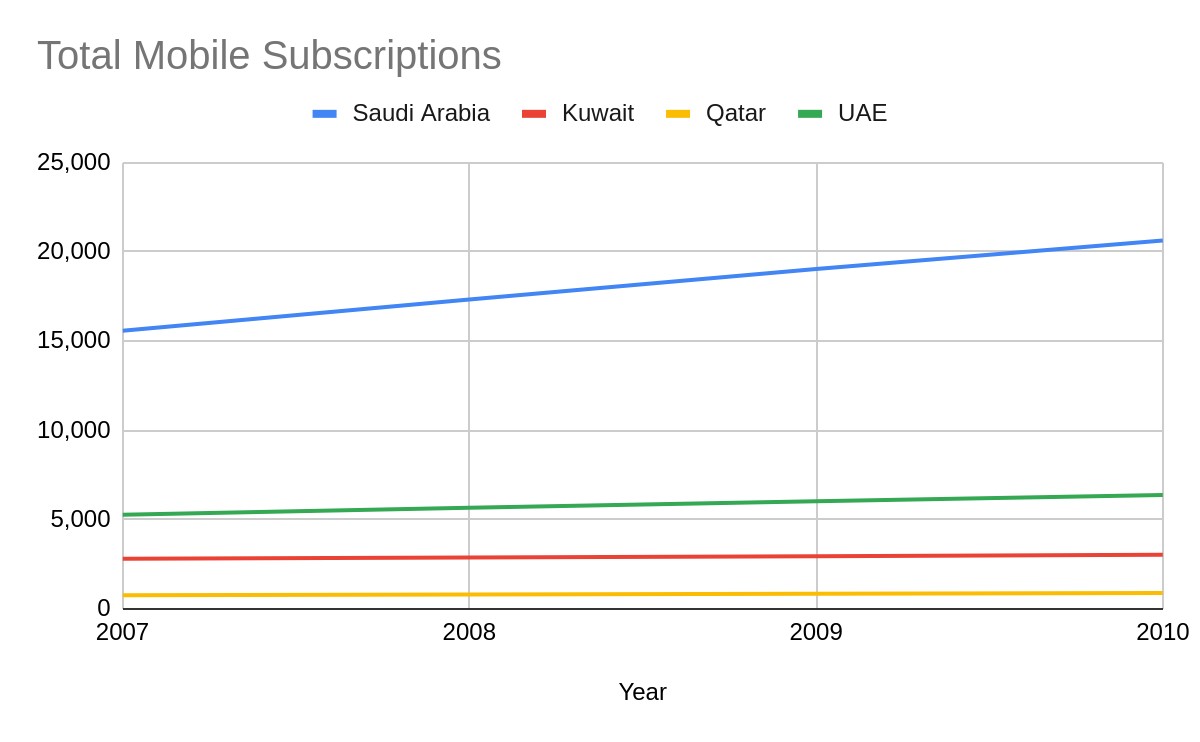
Total Mobile Subscriptions
The graph below shows the total mobile subscriptions of all the markets. Here, it can be seen that Saudi Arabia is at the highest followed by other markets, with Qatar being at the bottom. Here, it shows that the market of Saudi Arabia has more mobile subscribers than other nations. However, it also might be due to population count, which may get clear in the upcoming section on demographic analysis. At this point, the following graph shows better potential of Saudi Arabia’s market.
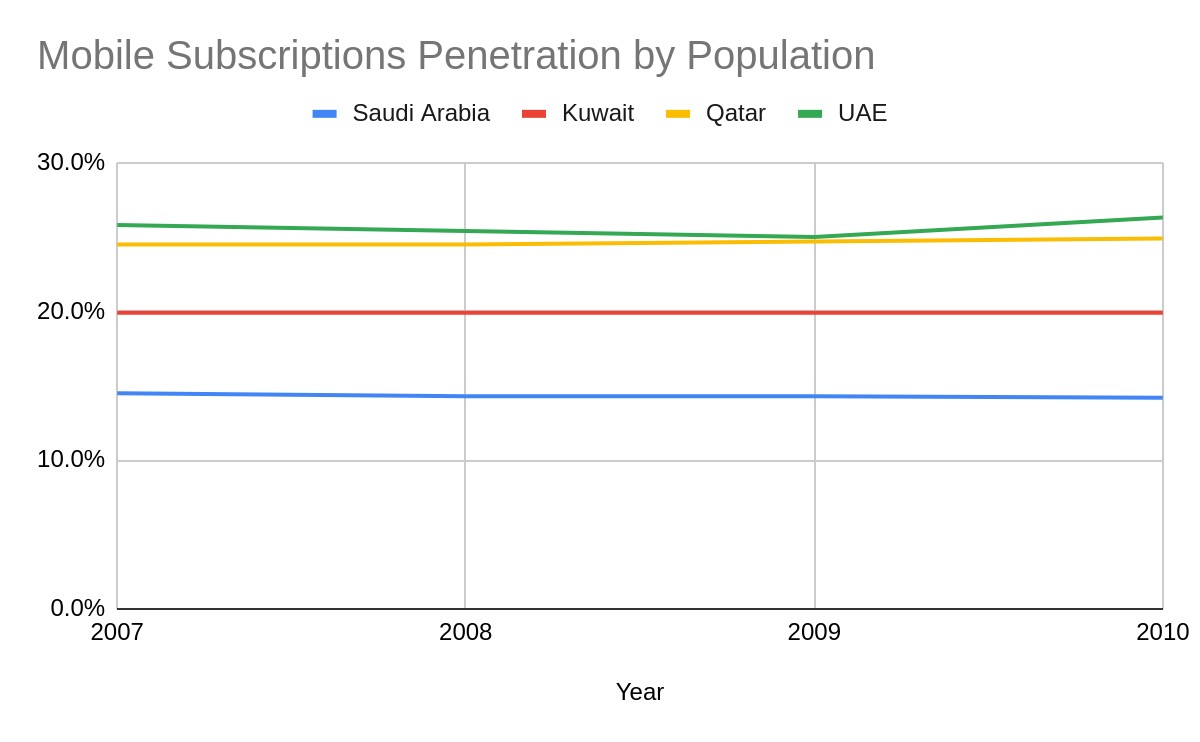
Mobile Subscription Penetration
The chart below is showing mobile subscription penetration by population of all the four markets. Here it can be seen that UAE is at the top, slightly running ahead of Qatar. Saudi Arabia has lowest mobile penetration. This chart helps in understanding that more people in UAE are using phones than Saudi Arabia in terms of population size. Here, it means that the company has a huge potential to capture a higher percentage of the untapped market in Saudi Arabia (Arkolakis). The company can focus on strategies such as penetration pricing and heavy promotions in this market. Moreover, one interesting point to note here is that the penetration trend in UAE and Qatar is slightly increasing, whereas that of Saudi Arabia is almost constant. This shows that the existing competitor companies in UAE and Qatar may be making some additional effort to further enter the market, whereas the market in Saudi Arabia poses less competitive challenges.
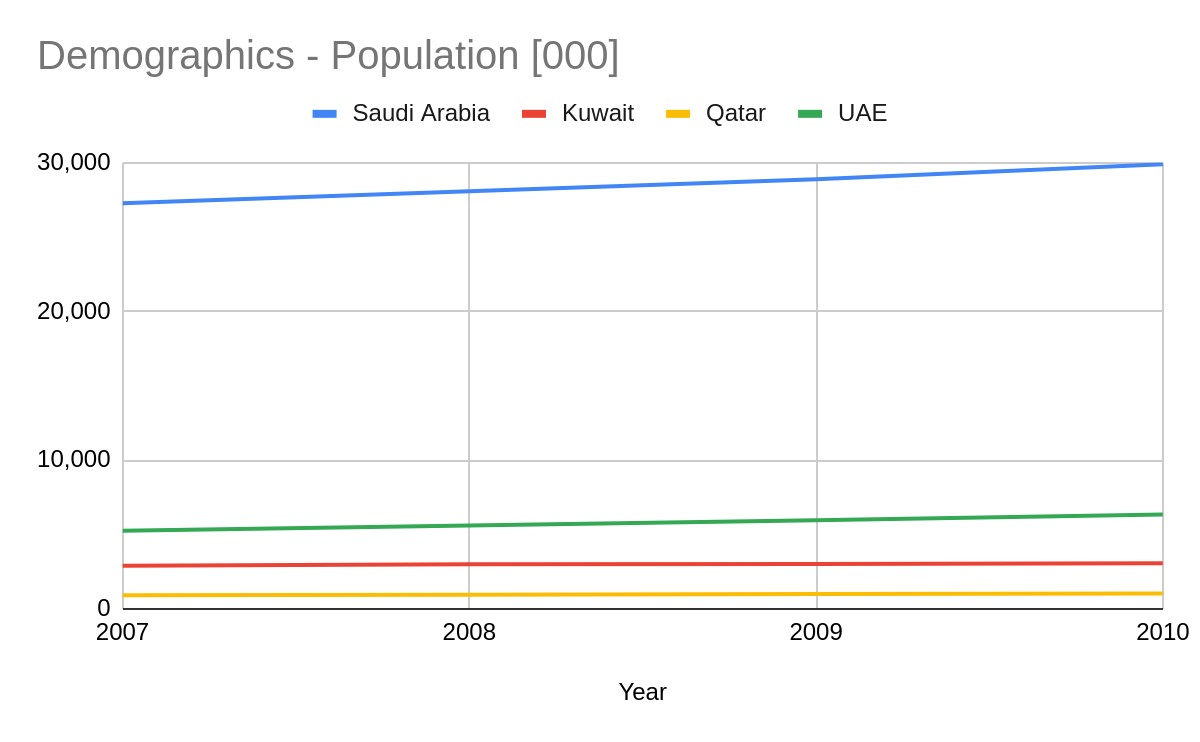
Demographics
The graph below shows the population of all these four markets. Here, it can be seen that Saudi Arabia has the highest population in comparison to other markets. In fact, in the comparison, the market that showed higher average revenue per subscription such as Qatar is lying at the bottom of the chart. In terms of population it can be said that Sauid Arabia has huge potential. High population means that the company can get the opportunity to serve more individuals, and thus more opportunity to earn revenue. Low population size gives lower opportunity as a revenue source. Another important point to note here is that the population of Saudi Arabia is constantly growing at a higher rate than other markets, which further adds to the benefit for the company.
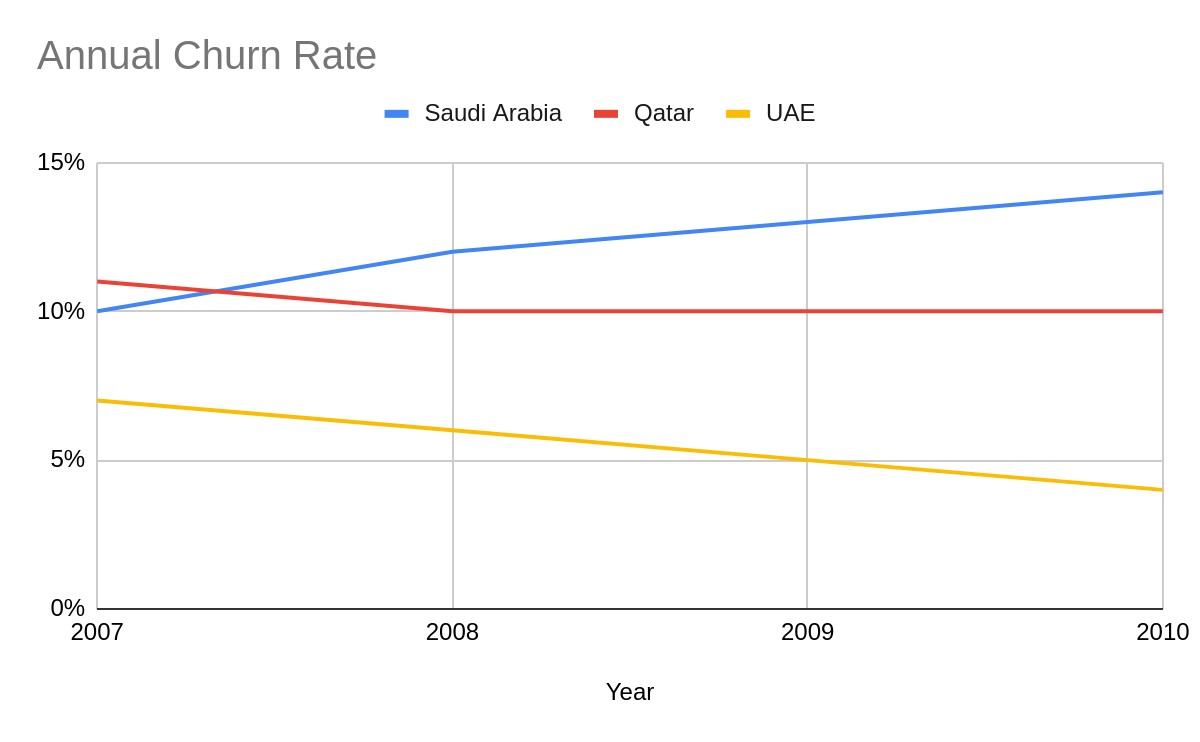
Churn Rate
The graph below shows the churn rates of all countries except Kuwait. In the available data, the churn rate of Kuwait was not available. It can be seen that the churn rate of Saudi Arabia is very high. Churn rate measures the individual leaving or moving away from a particular product or services over a certain period of time (Wong). Here, it can be said that higher churn rate shows positive potential for the company. It means that the company can easily sway the existing customers towards its own product. On the other side, if the churn rate had been low such as it is in UAE and Qatar, then it would be difficult to push customers to switch to the company’s services. Moreover, the graph shows that the churn rates of UAE and Qatar are constantly falling, which means that it is gradually becoming tougher for new companies to convert customers that are with competitors. On the other hand, the churn rate of Saudi Arabia is constantly on rise. Here, one important aspect is that the churn rate is double edged sword. If the company - Nokia Networks - will benefit from it by attracting customers to itself, then it may lose existing customers to others for the same reason. Thus, it has to make good efforts to retain those customers.
Recommendation and Conclusion
Considering the overall analysis based on all six variables, it can be said that the company - Nokia Networks - should choose Saudi Arabia as the first market for entry. There are several reasons that support this recommendation. The first is the population of the market. Saudi Arabia has the highest population that gives it an added advantage over other markets as the company can cater to more people. Another point is that this market has the lowest mobile penetration, which means that there are large parts of the untapped market that can be targeted by the company. Next aspect is that Saudi Arabia has shown the highest revenue year over year and the trend is going upwards with higher degrees than other three markets. The market has higher mobile subscription, and this can be attributed to the size of its population. Another benefit is the churn rate, which is quite high for Saudi Arabia and it has constantly gone in these four years. This gives a huge opportunity for the company to attract existing customers from the competitors.
References
Arkolakis, Costas. "Market penetration costs and the new consumers margin in international trade." Journal of political economy 118.6 (2010): 1151-1199.
Wong, Ken Kwong-Kay. "Fighting churn with rate plan right-sizing: A customer retention strategy for the wireless telecommunications industry." The Service Industries Journal 30.13 (2010): 2261-2271.