Relationship Between Hours of Study and Grade Point Average
Title of the project
Relationship between Hours of Study and Grade Point Average (GPA)
Research Question
What is the impact of weekly study hours on student GPA?
Parameters of interest: hours on study, GPA
Description of the Data Set
The quantitative data regarding the hours of study and GPA of students have been accumulated for this project. A survey questionnaire is used to collect the primary data regarding two variables. The survey was filled by 50 students of secondary school students. u using a survey questionnaire; thus, the sample size of the study is 50.
Descriptive Statistics of each variable
The descriptive statistics of the variables have been shown in the below table.
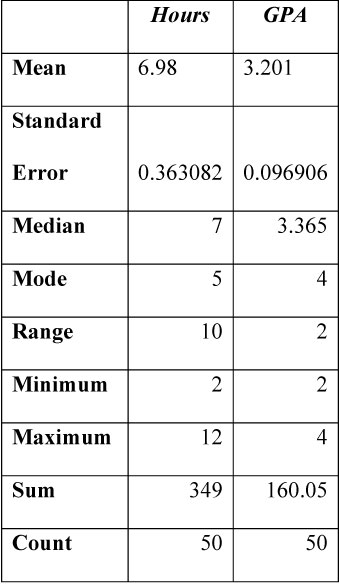
Table 1
Table(s) and graph(s):
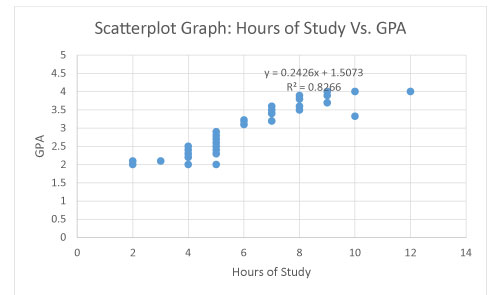
Figure 1
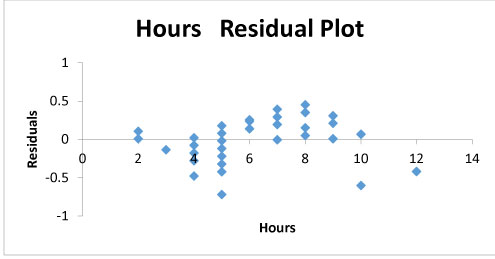
Figure 2
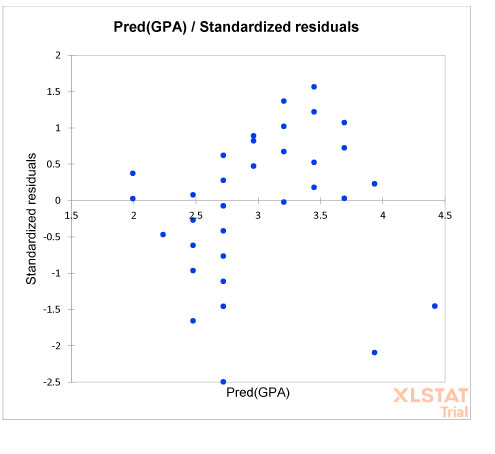
Figure 3
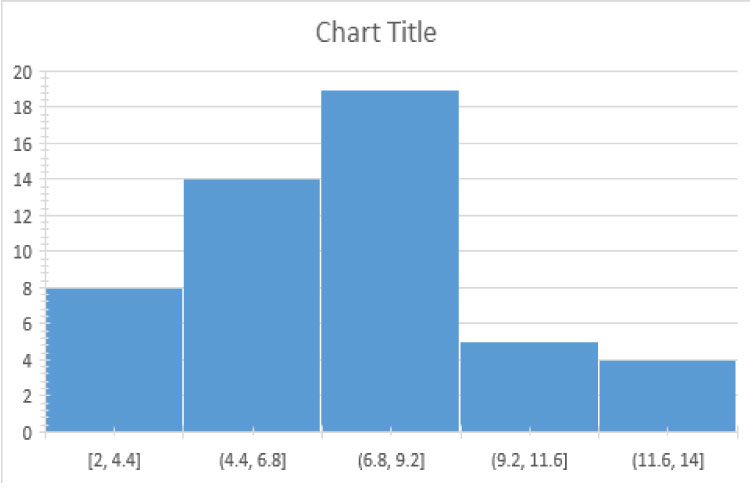
Figure 4
Testing of Assumptions
Assumption 1: The independent variable (hours of study) and the dependent variable (GPA) are measured on a continuous scale.
Assumption 2: The scatterplot presented in figure 1 shows that there exists a linear relationship between the dependent variable (GPA) and the independent variable (hours of study).
Assumption 3: The dataset does not incorporate any serious outliers.
Assumption 4: The data is collected from different students regarding their hours of study and GPA; thus, all the observations are independent of each other.
Assumption 5: The figure 2 shows that the variance of long the line of best fit is same along with all the data points of the independent variables; thus, the data follows the assumption of homoscedasticity.
Assumption 6: Figure 3 displays the residuals of the regression line. It depicts that residuals are approximately normally distributed.
Analysis: test, estimation
In reference to the research question, a null and alternate hypothesis can be formulated as follows:
Null Hypothesis:
H0: There is no significant impact of weekly hours of study on the GPA of the students (β1 = 0).
Null Hypothesis:
H1: Hours of study positively influence the GPA of students (β1 > 0).
The regression model corresponding to the research variables can be formulated as follows:
GPA = α + β1*hours of study
In the above equation, α and β1 are the regression parameters that can be estimated by performing a linear regression using Excel.
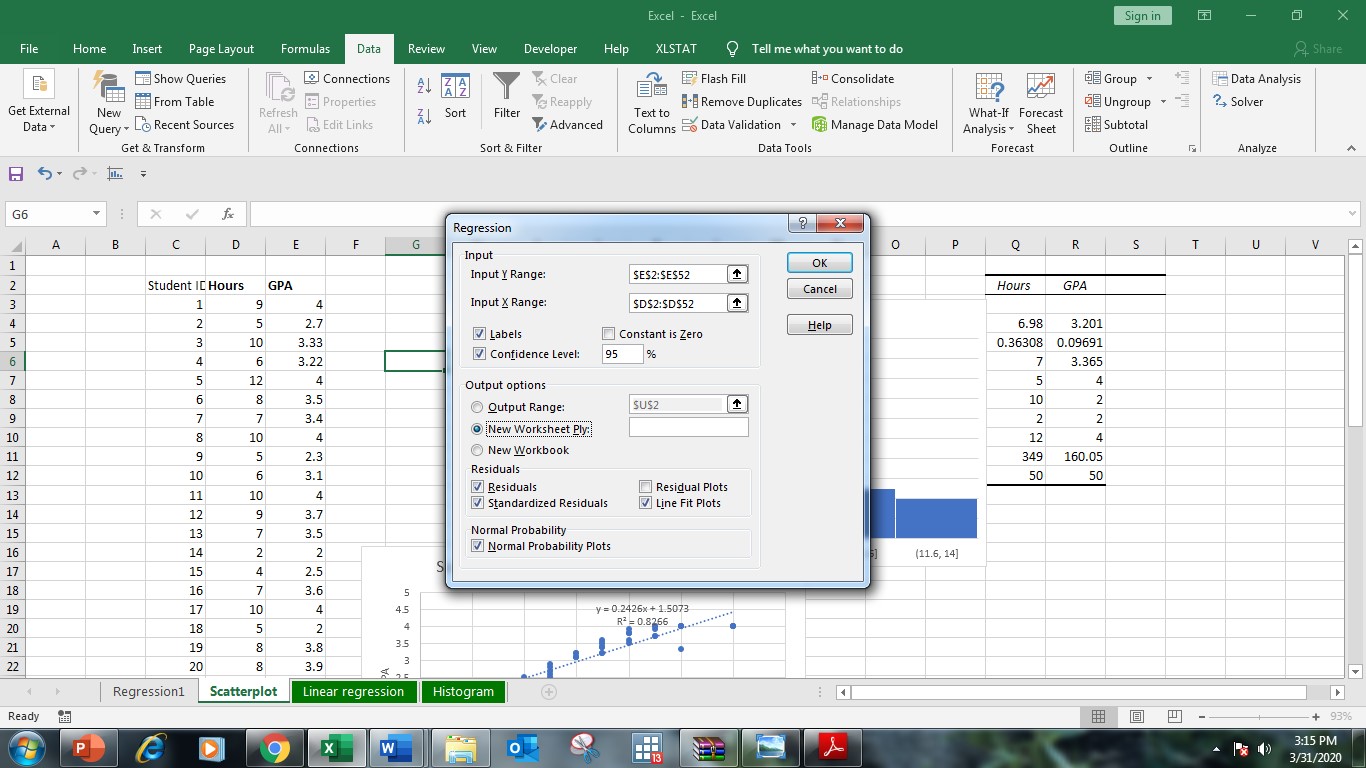
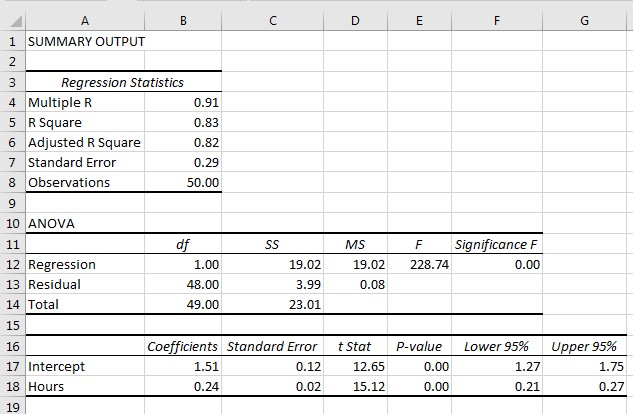
Figure 5
Results
The results of simple linear regression indicated that F(1, 48) = 228.74, p< 0.05,. The p-value obtained correspond to the ANOVA test is less than 0.05; thus, the model is good fitted. Moreover, the coefficient of determination (R2) = .83, which means that 83% variation in the GPA of students can be explained by their hour of study in a week. Further, p-value corresponding to β1 is less than 0.05 (β1 = 0.24, p < 0.05). The outcome of the regression test provides evidence for the rejection of the null hypothesis. It can be determined that H1 is accepted at 95% level of confidence. The regression model for predicting the GPA for a specific value of hours of study can be represented as follows:
GPA = 1.51 + 0.24 *hours of study
Conclusion
The statistical evidence reveals that hours of study positively influence the GPA of students as the value of regression coefficient is positive and it is statistically significant at 5% level of significance. It can be concluded on the basis of the study findings that the students who devote an increased number of hours in study obtain good GPA as compared to others. Thus, it can be suggested that students should study for around 10-12 hours in week achieve a higher GPA.
Bibliography
Garson, G. David. "Testing statistical assumptions." Asheboro, NC: Statistical Associates Publishing (2012).
Groß, Jürgen. Linear regression. Vol. 175. NY: Springer Science & Business Media, 2012.
Montgomery, Douglas C., Elizabeth A. Peck, and G. Geoffrey Vining. Introduction to linear regression analysis. Vol. 821. California: John Wiley & Sons, 2012.
Nieuwenhuis, Gert. Statistical methods for business and economics. NY: McGraw-Hill Higher Education, 2009.
Seber, George AF, and Alan J. Lee. Linear regression analysis. Vol. 329. California: John Wiley & Sons, 2012.
Stock, James H., and Mark W. Watson. Introduction to econometrics. 2015.
Yan, Xin, and Xiaogang Su. Linear regression analysis: theory and computing. NY: World Scientific, 2009.