Financial Analysis on Sony Corporation
Question :
Ratio analysis - 2015-2019
Profitability Ratios
• Current Ratio
• Quick Ratio
Liquidity Ratios
• ROI
• ROE
Leverage Ratios
• Inventory Turnover
• Asset Turnover
Activity Ratios
• Debt/Equity
• Long-Term Debt/Equity
As well as a ratio analysis for the industry (consumer electronics) average (2015-2019)
Free cash flow
Cost of Capital
Ability to raise additional capital
Relationships with creditors and stockholders
Dividend policy
Answer :
Financial Analysis of Sony Corporation
Ratio Analysis
Profitability ratio
Current Ratio
It entails the capability of a business to meet its interim debts using the liquid assets of the firm. The current ratio of Sony Corp throughout five years is as follows:
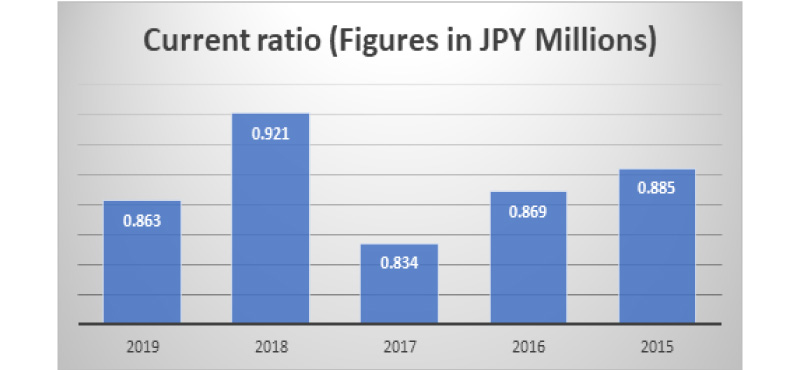
Graph: Current ratio of Sony Corporation (2015-2019)
(Source: Sony.net. 2019)
As can be seen from the chart above, the ratio for five years stood out at 0.86, 0.92, 0.83, 0.86 and 0.88 respectively (Wsj.com. 2019). It suggests that the company's liquidity is considerably low as the liquid assets are more depressed than its interim debts. It is because the company operates a significant portion of the business using short term debts which can be seen increasing with every passing year. Further, the current liabilities can be noted to have an increasing trend which indicates that the company does have used to fund its operation using short term debts (Svynarenko, Zhang and Kim, 2019).
Quick Ratio
It entails the expertise of a business to meet its interim liabilities using the quickest assets of the firm. The quick ratio of Sony Corp over five years are as follows:
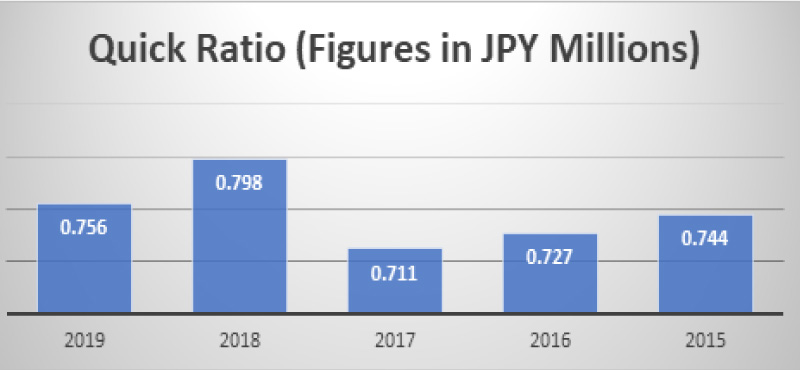
Graph: Quick Ratio of Sony Corporation (2015-2019)
(Source: Sony.net. 2019)
As can be observed from the above graph, the quick ratio of Sony corp can be perceived to be of a fluctuating trend. It is because the customer base of the company keeps on changing with every passing year depending on the intensity of competition and implementation of innovative products within the firm (Hong, 2018). However, it is evident from the appendix below, that the quick assets over the five years have gradually increased, which suggests that the firm is focusing on expanding its assets, thereby increasing its liquidity index.
Liquidity Ratio
Return on Investment
It shows how much Capital a company is generating through its investment project. The ROI of Sony Corp over five years is as follows:
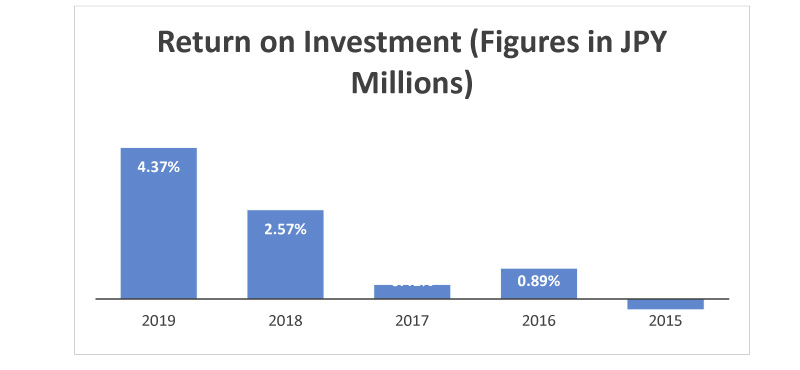
Graph: Return on Investment of Sony Corporation (2015-2019)
(Source: Sony.net. 2019)
It is evident from the graph above that the ROI of Sony Corp, is of an upward trend. It suggests that the firm is successfully increasing its returns from initial investing, thereby boosting its gross revenue for each of the passing years. The RO for the five years stood out at 4.37%, 2.57%, 0.41%, 0.89% and -0.31% respectively (Wsj.com. 2019). It highlights the fact that before, 2018, the company’s net revenue from total assets was not sufficient to fund most of its operation. It is because of the lack of innovative products in the market, along with fierce competition from all around the world (Kim and Im, 2017).
Return on Equity
It would entail the income generation of Sony Corp through its equity share capital over five years which is as follows:
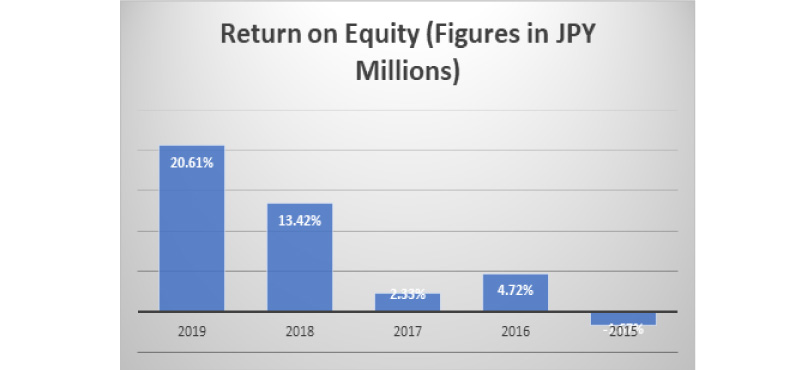
Graph: Return on Equity of Sony Corporation (2015-2019)
(Source: Sony.net. 2019)
So, the ROE for the five years can be observed to be of an increasing trend. It entails that the management of the firm has been consistently investing its equity share capital in an efficient manner which is resulting in a positive inflow of cash.
Leverage Ratios
Inventory Turnover
It indicates the number of times, a company has sold its inventory and replaced it with the new one. The Inventory Company of Sony Corporation for five years are as follows:
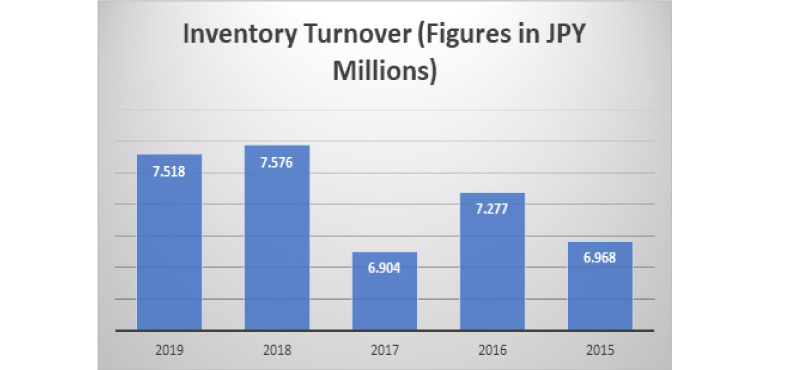
Graph: Inventory Turnover Ratio of Sony Corporation (2015-2019)
(Source: Sony.net. 2019)
As can be seen, that the ratio over five years stood out at 7.51, 7.57, 6.90, 7.27 and 6.98 respectively suggesting that Sony has turned its inventory more than six times in a year for all the five financial years (Wsj.com. 2019). It indicates that the company has a good sell to stock inflow ratio, and it tends to restock its inventory faster than it sells it stock out.
Asset Turnover
It indicates the expertise of the firm to generate revenue through its total assets.
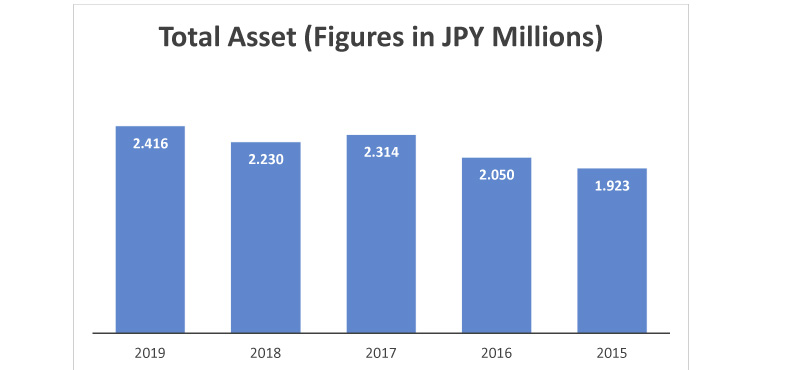
Graph: Asset Turnover Ratio of Sony Corporation (2015-2019)
(Source: Sony.net. 2019)
It is evident from the graph above that the total asset turnover of Sony Corporation is upward tending which suggests that the total assets of the business are generating a considerable amount of revenue for the firm. The Total assets for 2019 stood out at 2.41, which suggests that every ¥1 of assets made ¥2.41 in revenue, indicating that the assets generated double the Capital invested in it.
Activity Ratios
Debt Equity Ratio
It enables the firm to compare its use of debts and equity in funding its operations.
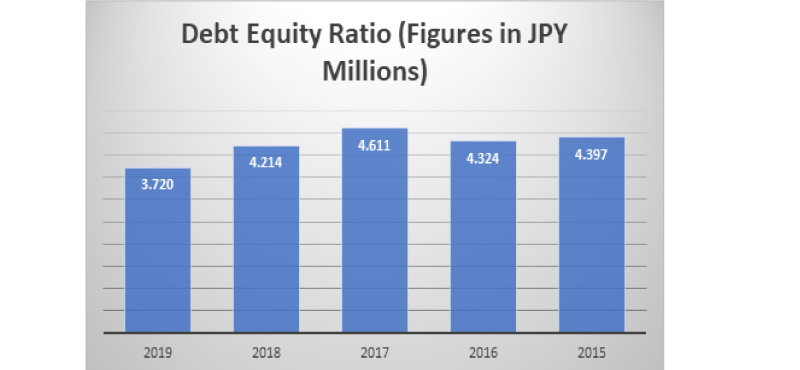
Graph: Debt Equity Ratio of Sony Corporation (2015-2019)
(Source: Sony.net. 2019)
Usually, the ratio of less than one is preferred by investors as it suggests that the debts are lower than equity. However, from the appendix below, it can be seen that the indebtedness of Sony Corp is significantly higher than its equity share capital indicating that the company's long-term liquidity is weak and it would create the burden of repayment in the future (Laitinen and Laitinen, 2018).
Long-term Debts to Equity
It compares the use of long-term debts and equity in financing the operations of the business.
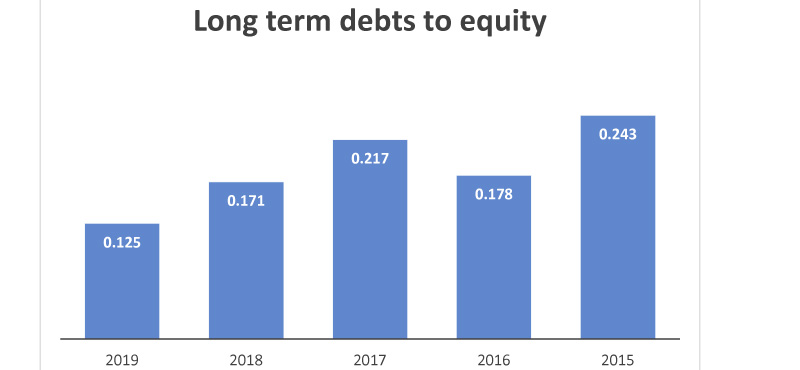
Graph: Long-term Debts to Equity Ratio of Sony Corporation (2015-2019)
(Source: Sony.net. 2019)
From the graph above, it can be seen that the long-term debts of Sony Corp are lower than equity share capital which suggesting that the company's long-term debts are given second preference in financing its operations.
Free Cash Flow
For the year ending 2019, Sony Corp has shown a high amount of dedication in creating new value and optimize their business. Further, the company combined all the segments of its products and business solution into one section called Electronics Products and Solutions, which generated cash flow for ¥90 billion (Sony.net. 2019).
Cost of Capital
For the year 2018, the company set a target of meeting 1% of its ROE and generating ¥2 trillion or more of cumulative three years of operating cash to generate higher returns than its cost of Capital by emphasizing on creating positive cash flow without letting its operations getting affecting by temporary factors (Higuchi, 2018).
Ability to raise additional Capital
As Sony Corp has a multinational presence with its outlets located in almost every country in the world, it makes the business highly dominant in its industry with enhanced capacity of raising additional Capital through external sources of funding in the time of need (Kunz, 2016).
Relationships with Creditors and Stakeholders
The company’s stakeholders maintain a healthy relationship with its creditors and take its short- and long-term debts seriously and try to repay all the outstanding debts before stimulated time thereby increasing the brand image and reliability of creditors on the company's ethical standards.
Dividend Policy
Sony Corporation follows a no dividend policy according to which the company would only pay out a dividend if it makes a significant amount of profit. However, the company fails to generate enough profit; it refrains from paying its shareholders their share of dividends (Sony.net. 2019).
Reference List
Higuchi, T., 2018. PROBLEMS OF CORPORATE GOVERNANCE AND MANAGEMENT OF SONY CORPORATION. Рекомендовано до друку на засіданні Вченої ради Харківського національного економічного університету ім. С. Кузнеця, протокол № 8 від 3 травня 2018 р., p.186.
Hong, S., 2018. Financial Situation Assessment of the Sony Corporation.
Kim, J. and Im, C., 2017. Study on corporate social responsibility (CSR): Focus on tax avoidance and financial ratio analysis. Sustainability, 9(10), p.1710.
Kunz, W., 2016. Sony Corporation. In Global Media Giants (pp. 253-268). Routledge.
Laitinen, E.K. and Laitinen, T., 2018. Financial reporting: profitability ratios in the different stages of life cycle. Archives of Business Research, 6(11).
Sony.net. 2019. Sony Global - Sony Global Headquarters. [online] Available at: <https://www.sony.net/> [Accessed 26 April 2020].
Svynarenko, R., Zhang, Q. and Kim, H., 2019. The financial burden of cancer: financial ratio analysis. Journal of Family and Economic Issues, 40(2), pp.165-179.
Wsj.com. 2019. [online] Available at: <https://www.wsj.com/> [Accessed 26 April 2020].